Eric J Ma's Website
written by Eric J. Ma on 2018-08-01 | tags: nxviz visualization data science software open source
A new version of nxviz is released!
In this update, I have added a declarative interface for visualizing geographically-constrained graphs. Here, nodes in a graph have their placement constrained by longitude and latitude.
An example of how to use it is below:
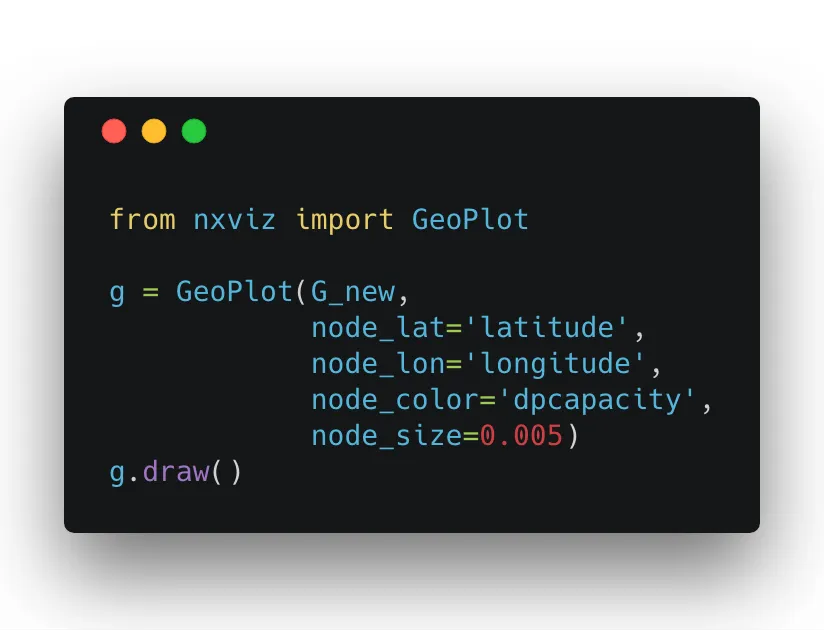
In the GeoPlot constructor API, the keyword arguments node_lat and node_lon specify which node metadata are to be used to place nodes on the x- and y- axes.
By no means do I intend for GeoPlot to replace more sophisticated analysis methods; like seaborn, the interface is declarative; for me, the intent is to provide a very quick-and-dirty way for an end user to visualize graphs with spatially constrained nodes.
Please enjoy!
Cite this blog post:
@article{
    ericmjl-2018-nxviz-05-released,
    author = {Eric J. Ma},
    title = {nxviz 0.5 released!},
    year = {2018},
    month = {08},
    day = {01},
    howpublished = {\url{https://ericmjl.github.io}},
    journal = {Eric J. Ma's Blog},
    url = {https://ericmjl.github.io/blog/2018/8/1/nxviz-05-released},
}
I send out a newsletter with tips and tools for data scientists. Come check it out at Substack.
If you would like to sponsor the coffee that goes into making my posts, please consider GitHub Sponsors!