Agentic data science with marimo pair
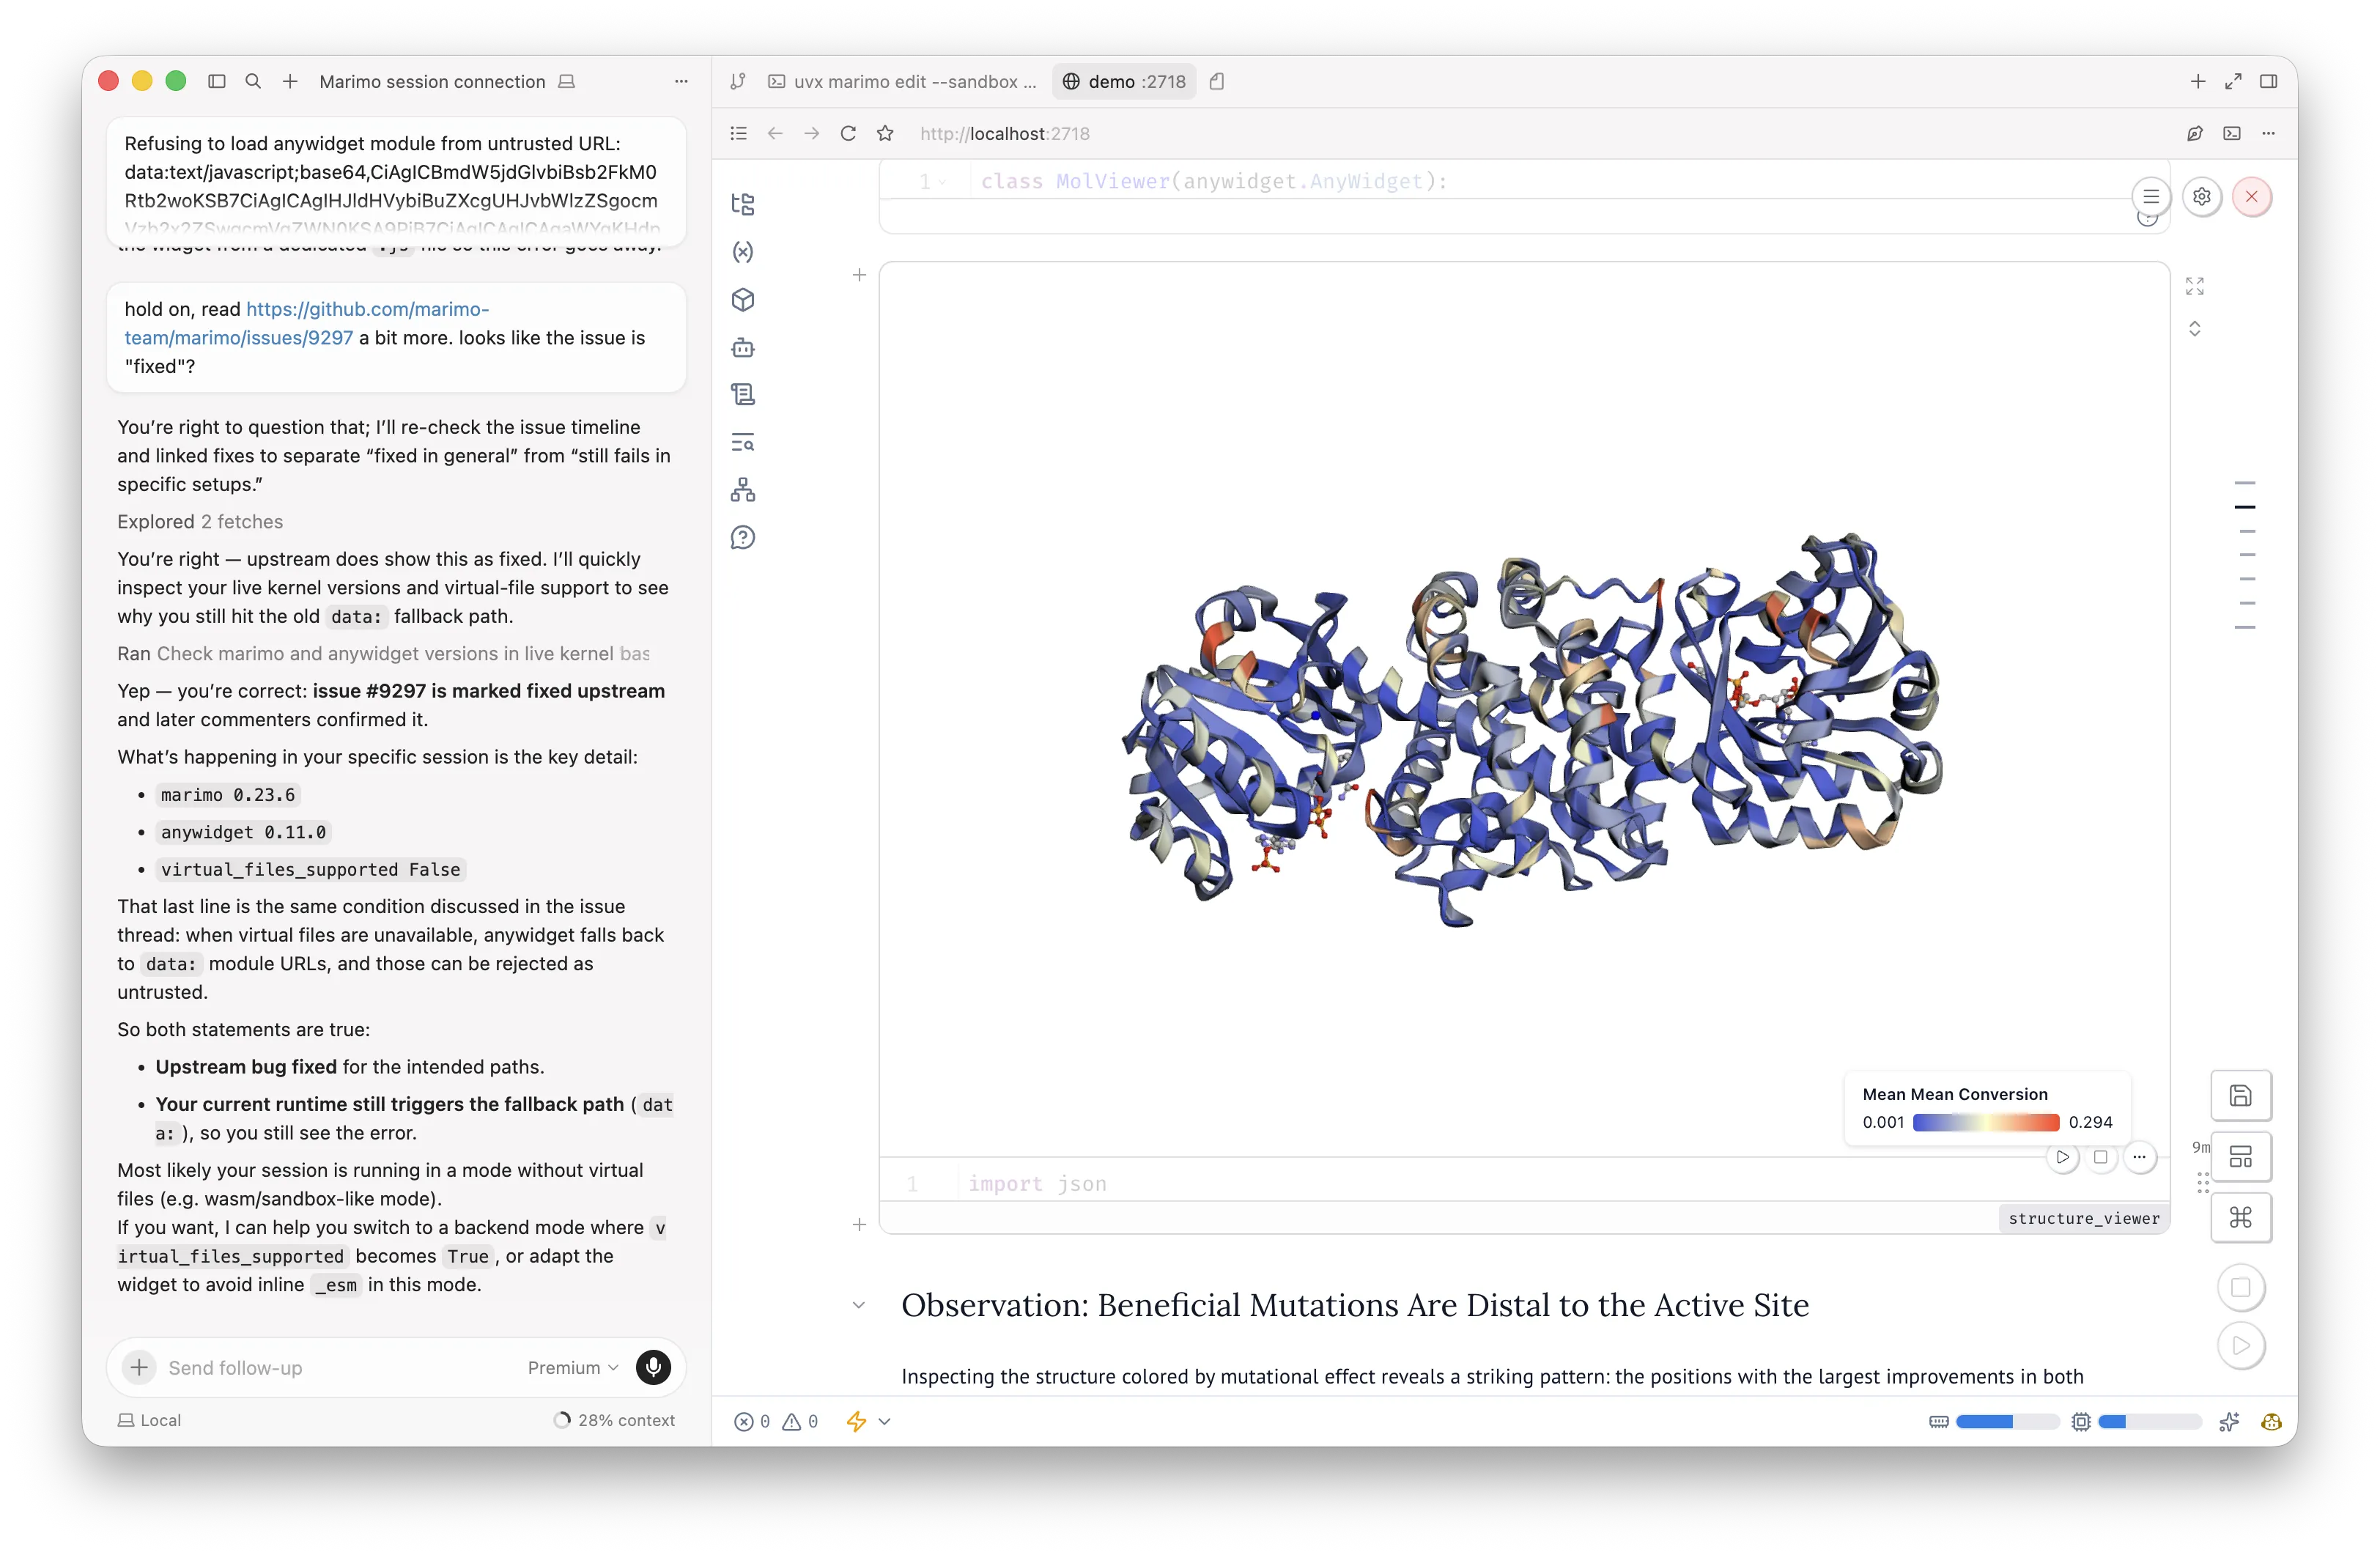
In a recent talk I gave on agentic data science, I built a custom 3D viewer for protein mutational effects in about twenty minutes of live coding. The viewer mapped each measured mutation onto the folded protein structure as a colored sphere, with a slider to filter by activity threshold. Two years ago, building that visualization by hand would have taken me days. The thing that made it possible in twenty minutes is marimo pair.
This chapter is about what marimo pair changes for agentic data science, and how to actually use it. If you'd rather watch the workflow before reading about it, here's the full session:
Agentic data science with marimo pair on YouTube
What marimo pair gives you
Marimo pair is a skill that lets a coding agent drive a running Marimo notebook directly. The agent can read the current state of variables in the kernel, add a cell and execute it, use a scratchpad to test small operations before committing them to the visible notebook, and build interactive HTML widgets that update as you adjust them.
That set of capabilities matters more than it sounds. Without direct kernel access, an agent writes code essentially blind. It guesses at column names, hallucinates row counts, and produces plots that look plausible but reference fields the dataframe lacks. With direct kernel access, the agent reads the same dataframe you do, runs operations against the same data you see, and reacts to real output rather than its best guess. Or it has to write to temporary files to execute code and read the output back in.
The scratchpad is particularly useful. When I ask for something non-trivial, like a plot that filters across several columns and applies a transformation, the agent can run the operation in a scratch cell, verify the output looks right, then commit the working version to the notebook. The mistakes happen in scratch and stay there.
Interactive widgets are the third capability, and the one that lifts the ceiling on what a single exploratory session can accomplish. The agent writes widget code, renders it in the live notebook, and you iterate on it together the way you'd iterate on a plot. The 3D viewer I mentioned at the top came from exactly that pattern.
Get set up
Install the marimo-pair skill into your coding harness:
npx skills add \
  https://github.com/marimo-team/marimo-pair/tree/main/skills/marimo-pair -g
Then start a Marimo notebook. The agent will recognize the live session and follow the pair protocol from there. The chapter on skills as reusable playbooks covers the general install pattern in more depth.
That's the entire setup. Everything that follows assumes the agent and the notebook are connected through the pair protocol.
Frame the question before you start typing
The first thing I do before opening a notebook is write one sentence: "If I learn X, I will do Y; if not, I will do Z." It sounds embarrassingly simple, but without that sentence, exploratory work drifts. Humans drift on their own. We follow an interesting side distribution, chase a surprising correlation, and thirty minutes later we've learned something genuinely interesting that has nothing to do with the original question. That's fine as intellectual exploration; it's a problem if you need to ship an answer.
An agent amplifies this tendency rather than correcting it. It will explore in every direction you leave open, and faster than you can redirect. So the decision sentence comes first.
Side questions that surface during the session go into a markdown cell pinned
at the top of the notebook labeled ## Parking lot. They might become their
own session later. Right now, they stay parked.
Work in small, precise asks
Once the session is live and the question is named, the work is two habits: ask for small things, and be precise about exactly what you want.
The temptation is to type something like "do exploratory analysis on this dataset." Resist it. The agent will happily produce thirty plots that orbit your real question without landing on it. The rhythm that actually works is much smaller: one question, one piece of code, look at the result, decide what's next.
Here's how it played out on the protein engineering dataset I used in the talk.
Start by reading what you have
The first ask was deliberately minimal:
Load
mutations.parquetand show me the first ten rows along with the dtypes.
Ten rows. Dtypes. Before any plotting, filtering, or modeling, I want to know what I'm actually working with. The agent ran it against the kernel and returned the output. I confirmed the structure matched my mental model: position in the protein, wild-type amino acid, mutant amino acid, measured activity. With that confirmed, the next ask had something concrete to build on.
If the agent had quietly assumed a different schema, this is where I would have caught it, before plotting anything against columns the dataframe lacked.
Be specific about columns, filters, and encoding
When you ask for a plot, the columns matter, the filters matter, the encoding matters. Vague requests get vague plots.
Compare:
Plot the data.
with:
Plot a scatter of
position(x) againstactivity(y), filtered to mutations whereactivity != 0, colored bywild_type_aa, with a log scale on the y-axis.
The second prompt produces exactly the plot I wanted. The first produces something the agent guessed at. In a live session, that difference is the difference between five seconds of work and five minutes of redirection.
After the plot rendered, I paused to write the interpretation as a markdown cell, in the same shape I use for every analysis step:
Claim: Activity-disrupting mutations are concentrated around positions 110-140 and 220-260.
Evidence: Scatter of activity vs. position across all 12k mutations.
Caveat: Position alone fails to capture 3D proximity. Two residues far apart in sequence can be neighbors in the folded protein.
That caveat is what set up the next ask.
Iterate on a custom widget
The flat scatter told me activity-disrupting mutations cluster in two sequence regions, but it left open whether those regions actually sit near each other on the folded protein. Sequence proximity and structural proximity are different things. To answer the question I cared about, I needed a 3D view.
I started with a basic ask:
Make me a 3D viewer of the protein structure with each mutated residue as a sphere, colored by its measured activity effect.
The first version showed spheres against an empty background; the protein backbone was missing, which made the spatial relationships hard to read. I iterated:
Add the protein backbone as a ribbon underneath the spheres.
Then:
Make the spheres semi-transparent so I can see overlapping residues.
Then:
Add a slider that filters spheres by activity threshold, with a default of showing only mutations that reduce activity by more than 50%.
Each ask was small and specific. After three or four rounds, I had a custom 3D viewer that answered the question I'd been carrying since the scatter plot. The high-impact mutations were clustered around the active site, not spread across the protein.

Building that viewer by hand would have taken me days. Most of the time would have gone into wrangling the rendering library, looking up coordinate conventions, and writing the slider plumbing. With the agent driving the kernel and rendering directly inside the live session, it took twenty minutes. The viewer existed only as long as I needed it for that question, then stayed in the notebook record as part of the analysis it supported.
Write the narrative as you go
By the time I closed the session, the notebook read as a coherent argument rather than a transcript of executions. Each plot had a markdown cell next to it: the claim I was making, the evidence behind it, the caveat I was holding onto. The 3D viewer had a paragraph above it explaining what I was looking for and what I found.
The agent can help shape rough notes into readable prose, but the judgments about what matters, what to doubt, and what to follow up on are yours to make. A readable notebook at the end of a session is a genuine asset: someone else can follow the reasoning, and future-you can pick up the thread. A silent stack of cells is debt you'll pay when you return to it in two weeks.
When the loop breaks down
I've done all of these at some point:
- Running probe after probe without pausing to interpret, letting output accumulate while my actual beliefs stayed stuck.
- Sending a prompt like "double-check everything" with no specific discrepancy in mind.
- Letting the agent write the conclusion cells and accepting them without owning the judgment myself.
- Building a reusable pipeline during a probe that got thrown out after a single plot.
- Treating the session as done when the notebook looked full, rather than when the question was answered.
The failure mode is always the same: speed without direction.
How this connects to the rest of the book
The automation philosophy applies here:
standardize the checks that let quality scale with speed, like marimo check
and the pair skill, documented in AGENTS.md. That way you spend attention on
the science, not on the mechanical parts.
The single source of truth philosophy
applies too. The notebook narrative, combined with corrections you fold back
into AGENTS.md, keeps both the story and the agent's behavior anchored to
the same record.
And the just-in-time adoption principle: reach for marimo pair when exploratory agentic work is frequent enough that you'll feel the payoff. It carries real setup cost. Save it for the analyses where direct kernel access genuinely matters.
Related reading: Working with AI tools, Safe automation with
coding agents, Advanced workflows with coding
agents (for file-based Marimo editing with --watch
and marimo check), and Use notebooks effectively.